I am not going to make this an in depth post about Google analytics because there are tons of them out there. This is a post for those that haven’t looked at analytics, have never heard of it or denied someone that highly recommended analytics. (I also don ‘t need comments on what I didn’t think of; trust me we have. I am just not going to write it all out or give it all away)
Your analytics (not just google analytics) are essential because you can get SOOO much valuable information out of them. Below are a FEW of the easier options you can look at in Google Analytics. There is so much more and I am not going to go into each. I am hoping this simple post will show you that the information you could receive is valuable.
I am going to show you some examples from a non-profit we do free work for, BigCatHabitat.org. You can click on these pictures to see them more clearly.
Content Performance
I took the top ten performance pages. With this data I can see that an event at Big Cat this month, the Extravaganza, is getting some great traffic. This is a page we wanted people to visit because they can buy tickets there. We can see that the home page has over 9,000 page views, that tigers seem to be more popular that lions and that the gallery has the highest bounce rate.
This kind of information is important to have! Perhaps there should be more blogging about tigers? Or perhaps we are not doing enough to promote the lions? The gallery isn’t the most user-friendly…perhaps we need to work on that…OR maybe the pictures of the animals on each page are more appealing? This data gives a lot to consider and focus on marketing wise. Just imagine the info you could get from your service or products pages.
One of our car dealer clients was able to track and see that 58 percent of their sales in a month were directly from the used inventory pages on their site. They kind of loved us after that 🙂
Visits by Location
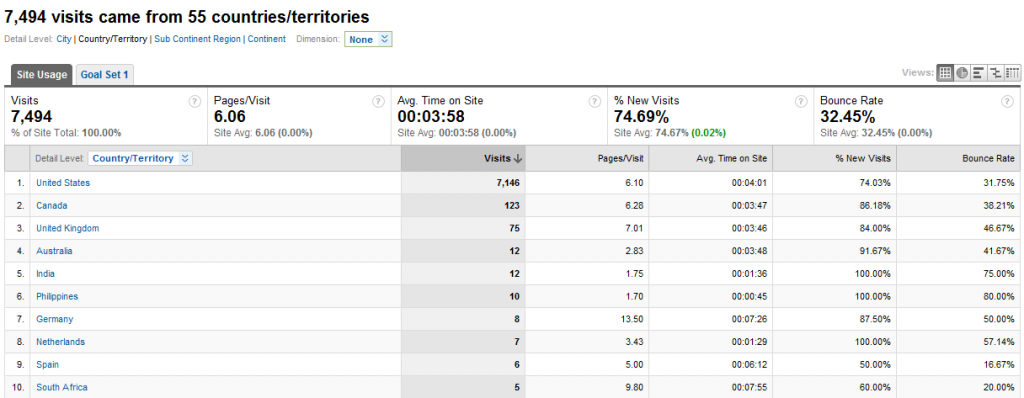
With this picture we can break down the numbers by country.
You can see that the bounce rate is low in these top ten countries with the exception of India and the Philippines (which is to be expected). So, this says that our site must have some good information or photos because people are staying. I think the people like to look at beautiful animals and there are plenty to look at on this site. If this is the case then the massive amount of hours spent taking photos, editing photos and adding photos to the site was well worth it, right?
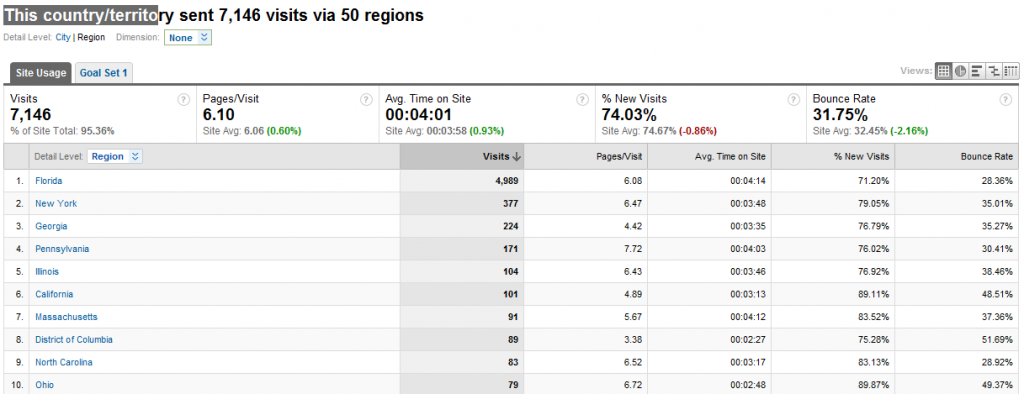
Now we can look at the numbers by state in the USA.

We are in Florida and most of our traffic is from Florida, which is great. It isn’t a bad thing that we have hits from different states because many people are looking for activities when they travel. Many people are looking for organizations to donate to and there are several that are looking for a good home for their excotic animal.
We can break down these states into cities and keywords. With the keywords we can see what they were looking for and determine whether they found it or not. Extremely valuable information for every site.
Referring Sites
Here we have the top ten referring sites. With this data you can see if marketing strategies you are using on other sites to drive traffic to your site is working. You need to look at page views, time on site and bounce rate. If you look at #3 above – StumbleUpon you will see that the bounce rate is very high at 85%. I find that most Stumble traffic is, so I don’t use it as a way to gain traffic because it isn’t quality traffic from what I can see. Your referring sites give you valuable data and can help you see what works, what doesn’t or what you need to work harder on.
Visits from Mobile Devices
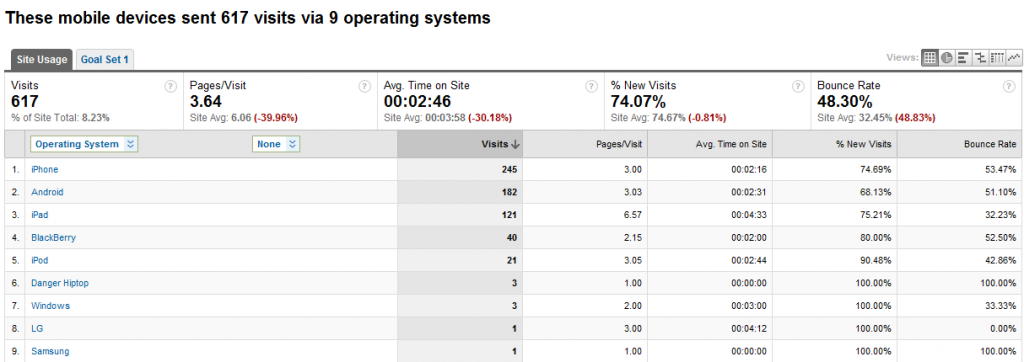
It is critically important that your website looks good and functions well on mobile devices. Take a peak at these numbers…
There are 617 visits and only two devices looked at only one page. Perhaps they were looking for a phone number or maybe the site was hard to view on their phone. These are things to consider. However, we see that iPad users are spending a good amount of time on the site- GREAT! iPhone and Droid users are doing pretty well also. We can see by the numbers that we want to make sure that all is working well for iPhone users. There is much to consider.
What I Want You To Understand
Analytics are really important. If you are not using any analytics you can’t possibly determine if your website is working for you or if your online marketing strategies are driving quality traffic to your site. You can’t see where you are failing or where you are succeeding. You can’t see what you must work on…you need analytics.
—————————————
Going to plug SEO Aware here. We do monthly analytics interpretation reports for clients and work with them each month to develop strategies to meet their goals. If you need some help contact us.


Couldn’t be any more right about the analytics… the map overlay of clicks is really nice as well.
Also, if all the pictures are like this one I can see why people spend time on the site. Very nice.
Clay, I LOVE the map overlay 🙂
And the pictures I put on there all look that good…what they may have added themselves I am not sure 🙂